Tynt.ai, AI Image-generation App · Data-driven UX
Redesigning the home from discovery to selection
Restructured the home so users find presets faster and move naturally into selection and upload — lifting preset selection conversion by 7.4%.
- My Role
- Sole Product Designer — UX/UI, IA, Browsing Flow
- Duration
- 3 Months
- Team
- PM, AI Researcher, Engineer, Content Marketer
- +7.4%
- Conversion liftPreset selection, home → preset
- +9.2%
- Upload completionAfter improving the photo-upload flow
- #34 → #14
- App rankingGoogle Play Photography category
- +26%
- Weekly revenueAfter the home and browsing redesign
Browsing that rarely led to image generation
Users stayed ~5 seconds and left after ~3 presets. The problem wasn't content volume — it was the browsing flow itself.
The home is where every session starts, and most of them ended there. The heatmap showed 82% of clicks landing on the banner and tabs at the top, with attention dropping sharply right below. Most of the presets further down were never seen.
- 5 sec
- Avg. sessionMost users drop off on the home
- 10.8%
- Avg. scroll depthLeft after viewing only 10.8% of the page on average
Redesigning the browsing experience with data
Defined the problem from behavioral data, redesigned the browsing structure, then validated with data.
Analyze behavior
Identify drop-offs and browsing patterns
Redefine IA
Prioritize home content using data
Optimize browsing
Simplify browsing and selection
Validate impact
Compare before vs. after metrics
Redefining the home IA based on conversion data
Redesigned home exposure priority from user behavior and conversion data.
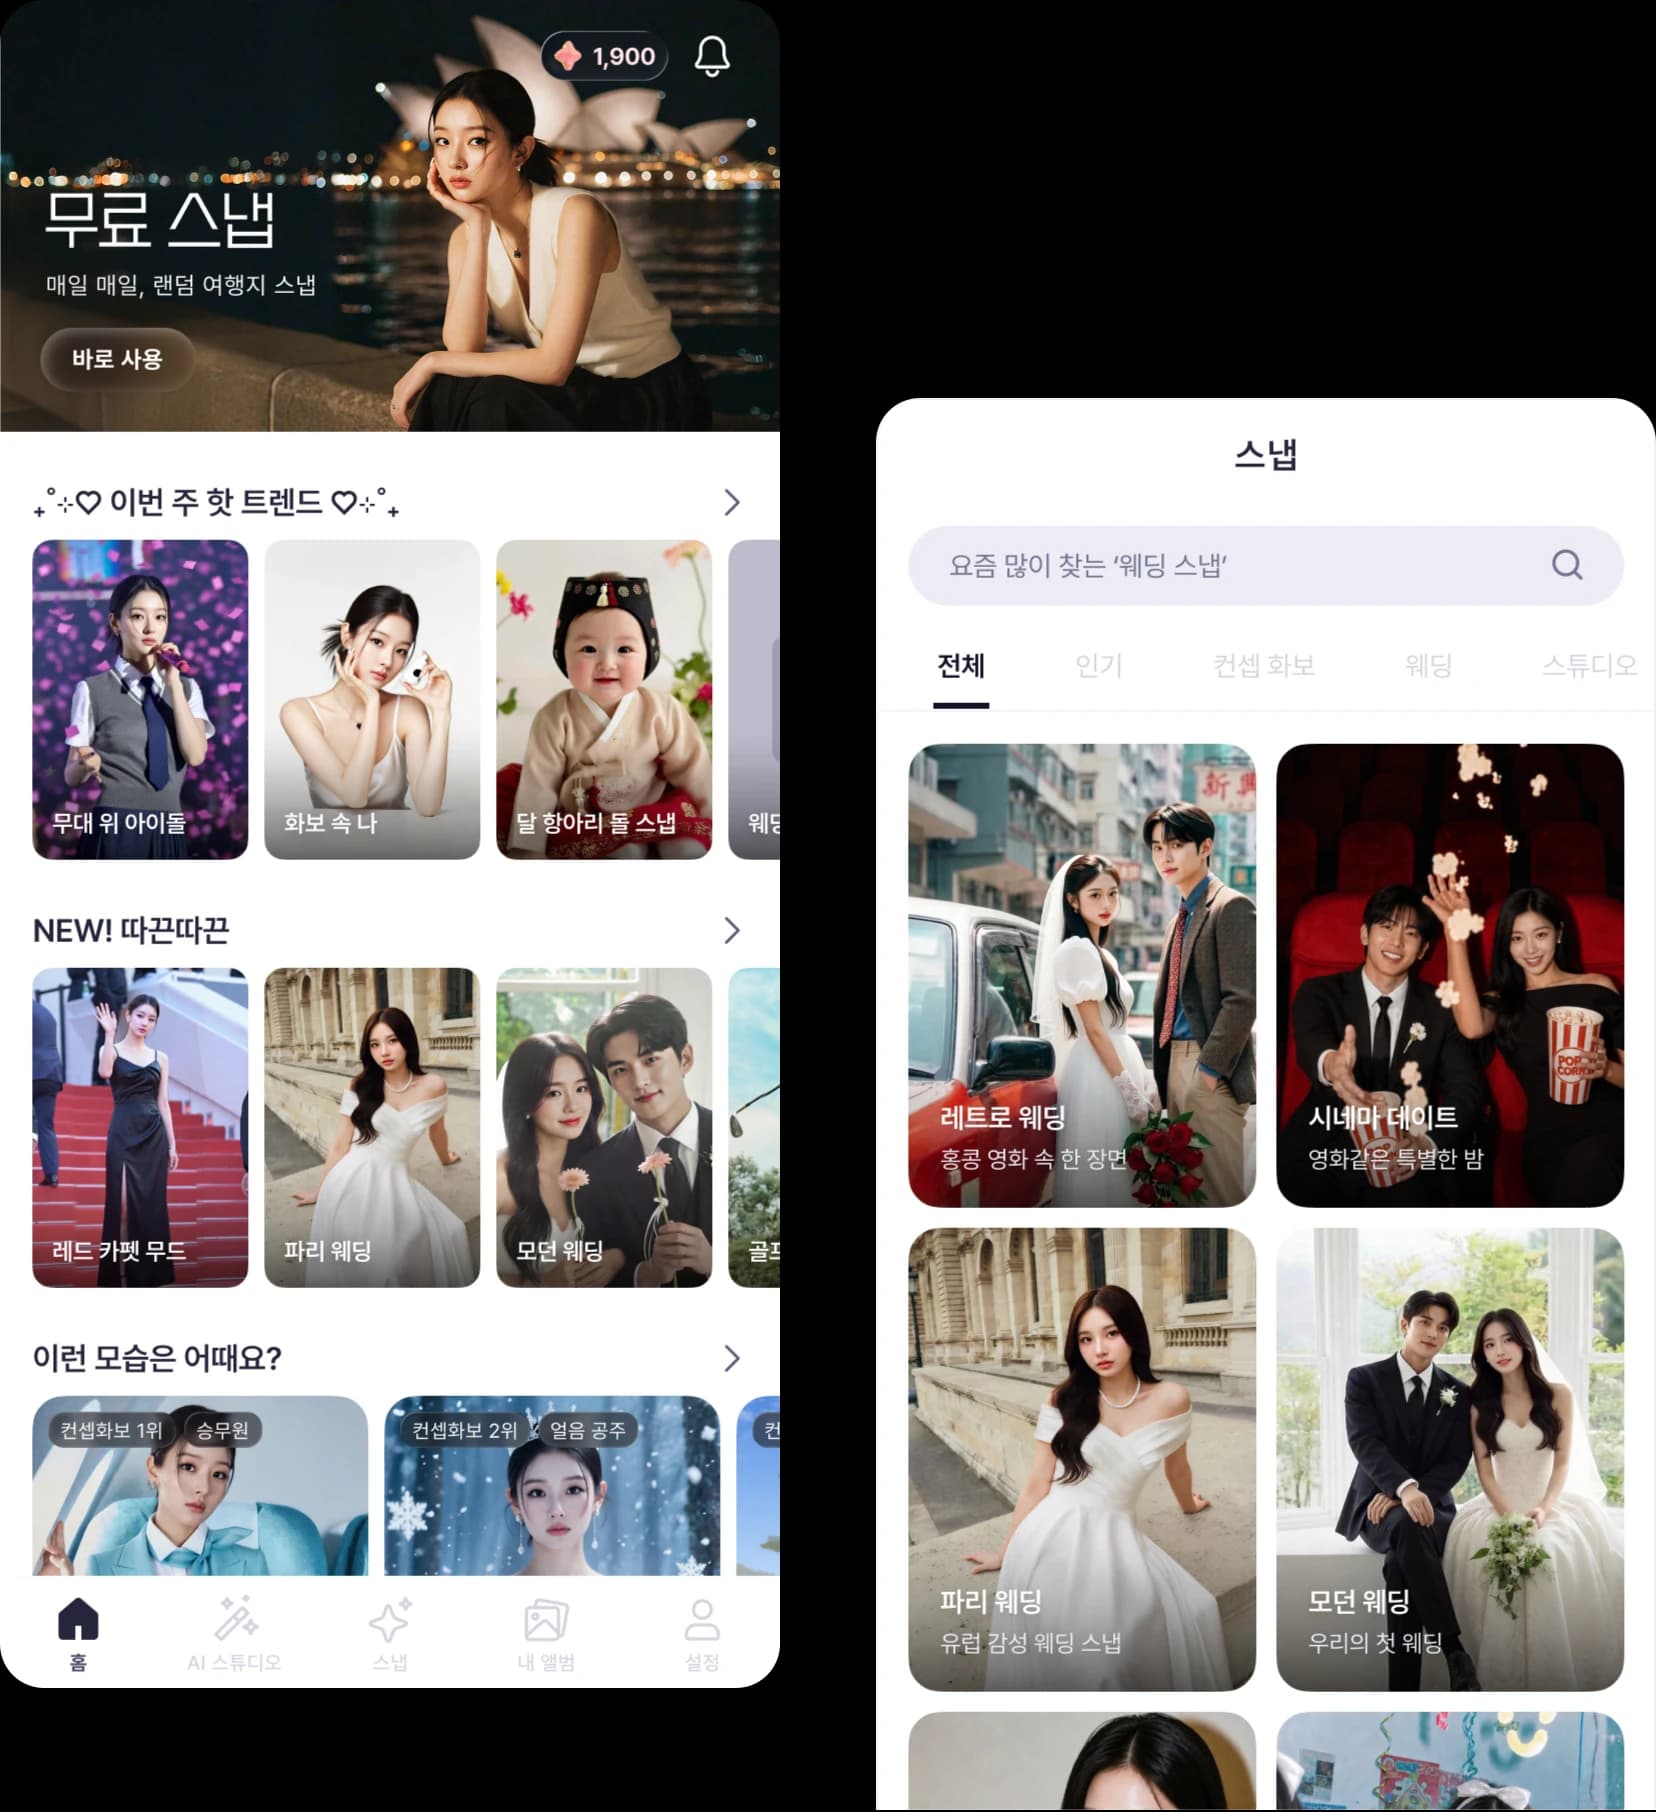
I regrouped the full preset pool by how each group converts, then gave every group its own place on the home: what sold recently, what is new, what converts best, and what matches a clear intent such as travel.
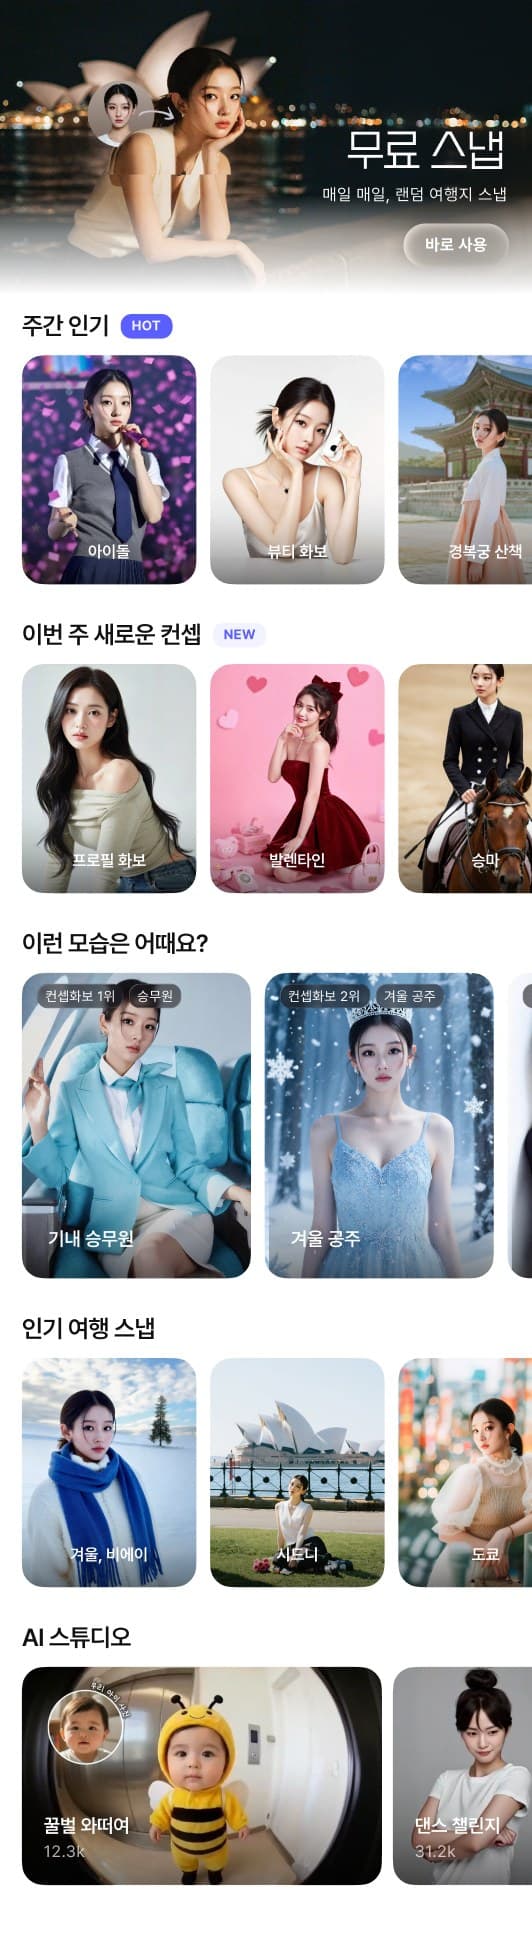
Exposure logic
Full preset data pool — 60+ shoots, 10+ added weekly — categorized by conversion characteristics.
Redesigning the core browsing flow
Progression toward paid presets was weak — reprioritized the first screen to start selection earlier.
The old first screen repeated the free-trial call to action three times and left room for only two presets. I reduced the free-trial area so more presets fit on the first screen and selection can start right away.
- Reduced free-trial emphasis area
- More presets on the first screen
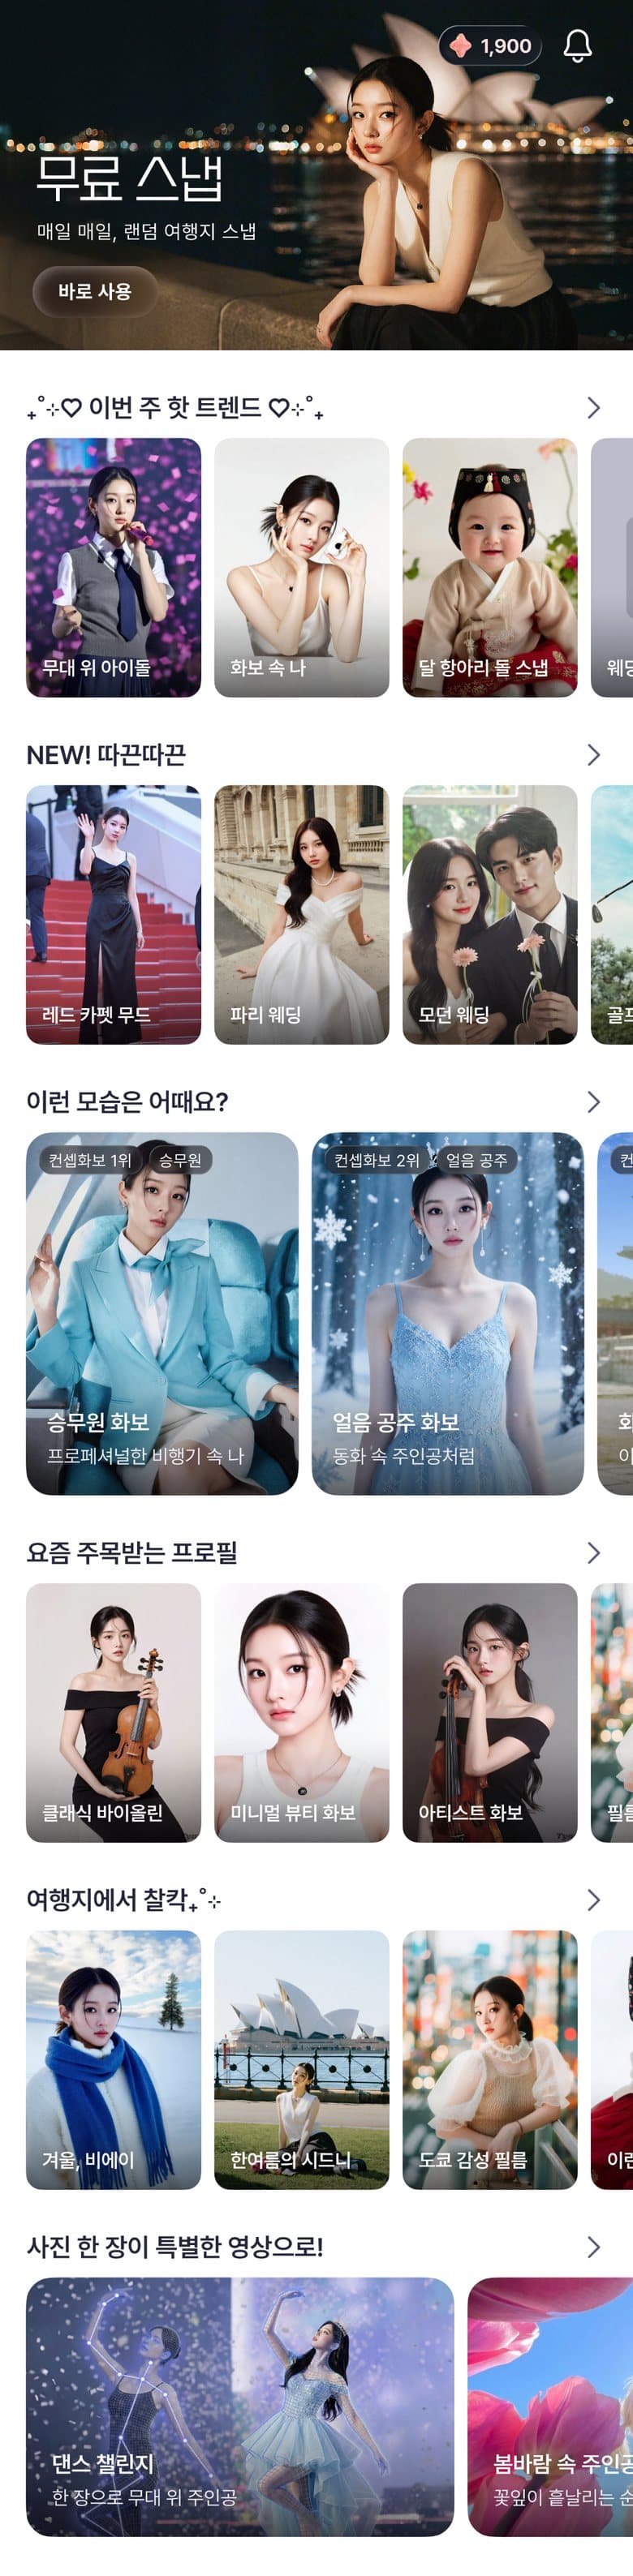
Scroll inside the phone to browse the full home, then switch versions to compare.
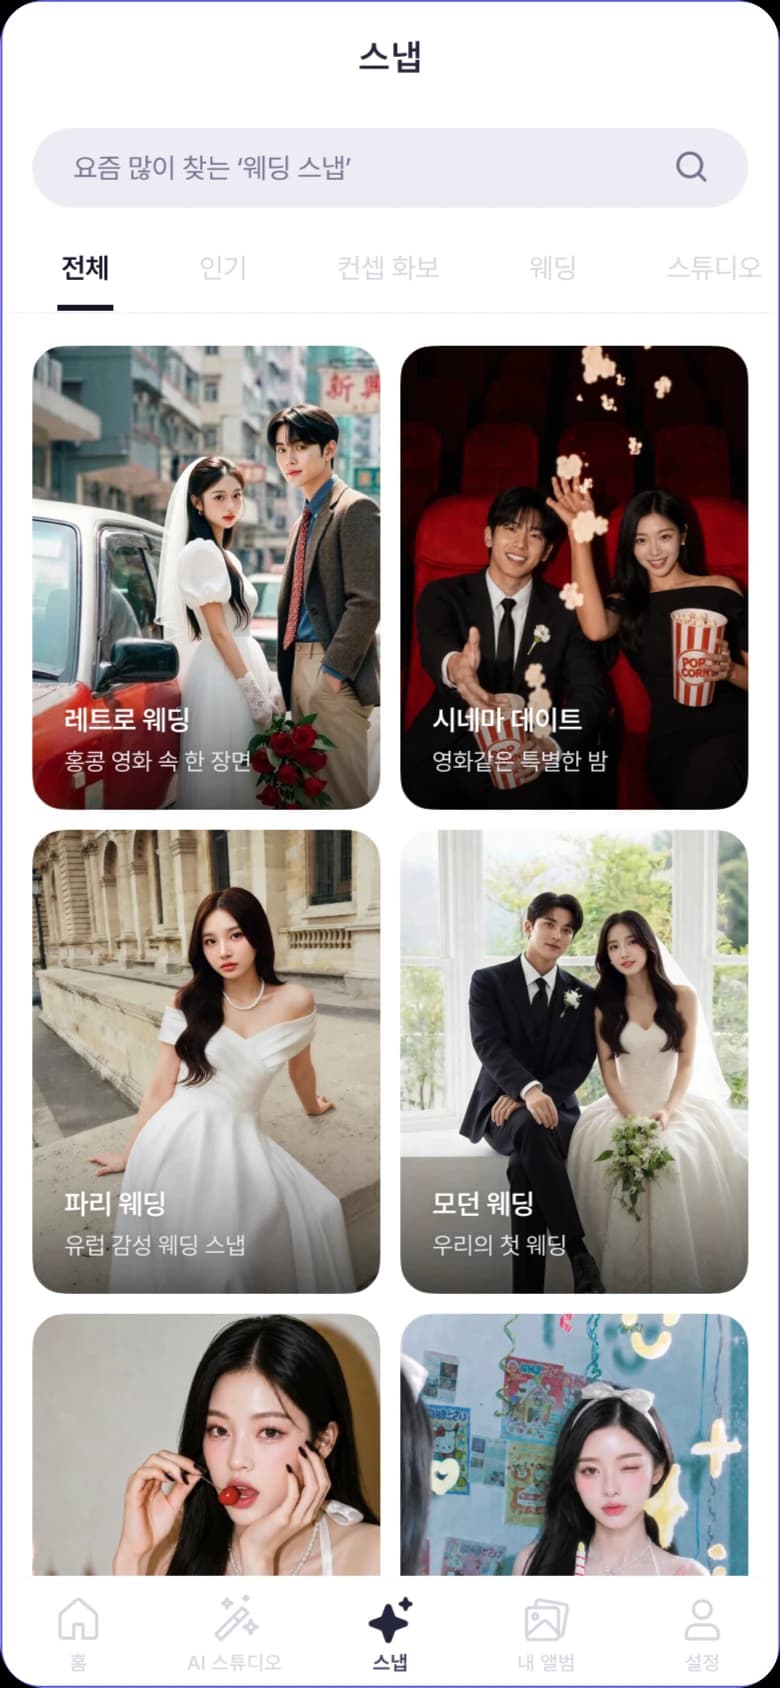
From recommendations to browsing
Split recommendation and browsing into distinct roles so users find presets more easily.
Home
Recommended content
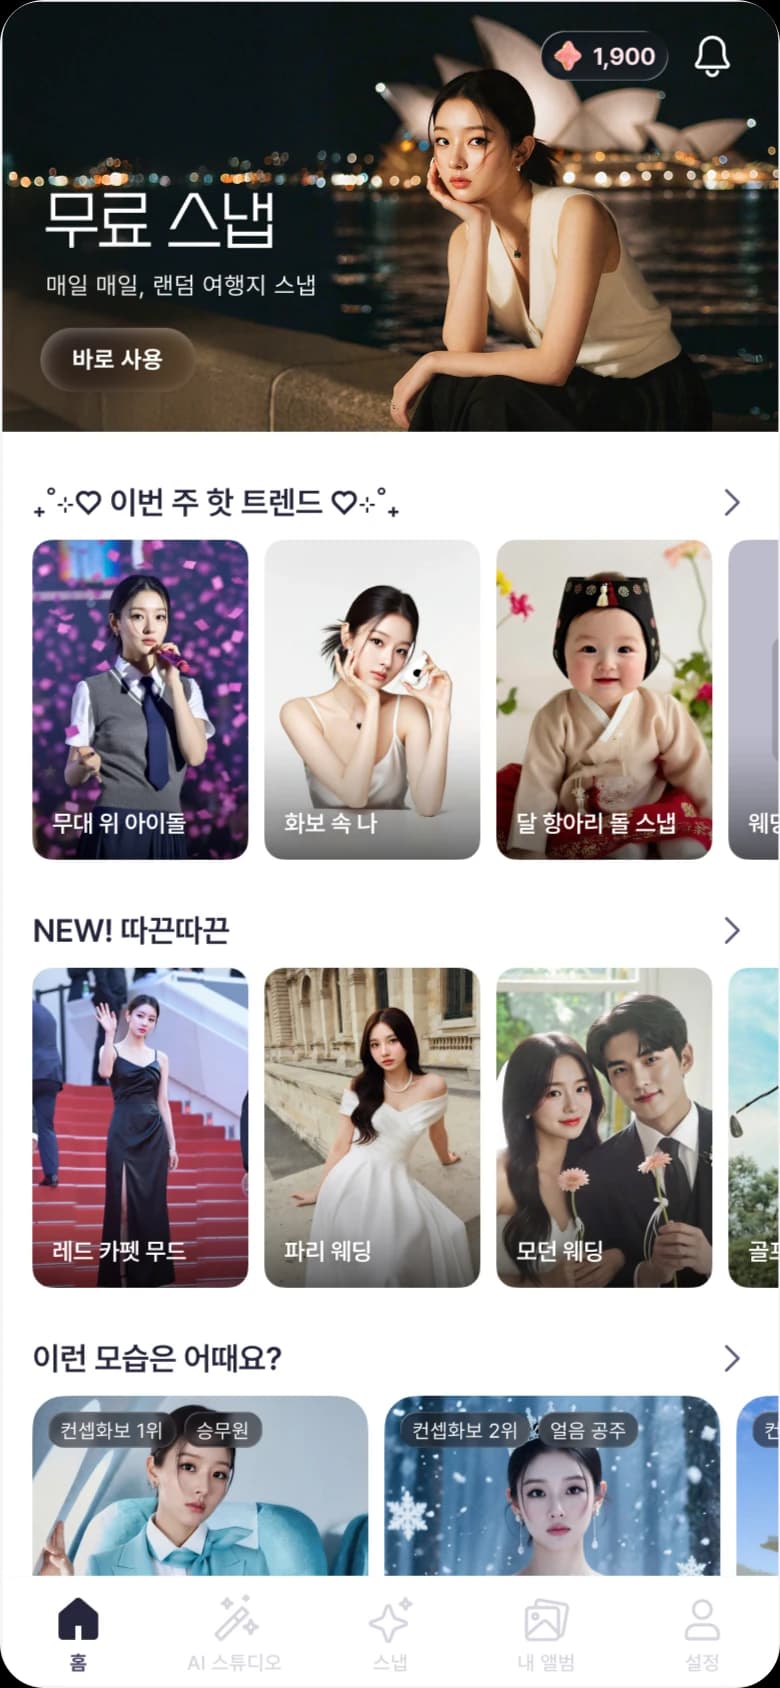
Snap (browse all)
Browse all presets
Redesigning the home to drive scrolling
Redesigned the home to strengthen selection — more users scroll farther and move on to preset selection.
After the redesign, attention no longer stops at the banner. It shifts to the preset area in the top 12–22% of the page and continues through the sections below.
Preset selection conversion (Home → preset)
Period: same-length before/after comparison · Tools: Mixpanel, Microsoft Clarity
Browsing redesign improved key metrics
Improved IA and browsing lifted both user-behavior and core business metrics.
Upload Completion
Higher completion after improving the photo-upload flow
Conversion Lift
Higher selection conversion on the core revenue model
App Ranking
Rose on Google Play's Photography chart
Weekly Revenue
Revenue up after the home and browsing redesign
Period: 2025.12 – 2026.02 · Tools: Mixpanel, Microsoft Clarity
Note: Payment conversion and revenue also reflect the impact of marketing and content updates.